A Technical Due Diligence Report Based on 20 Recent SaaS Audits
Executive Summary
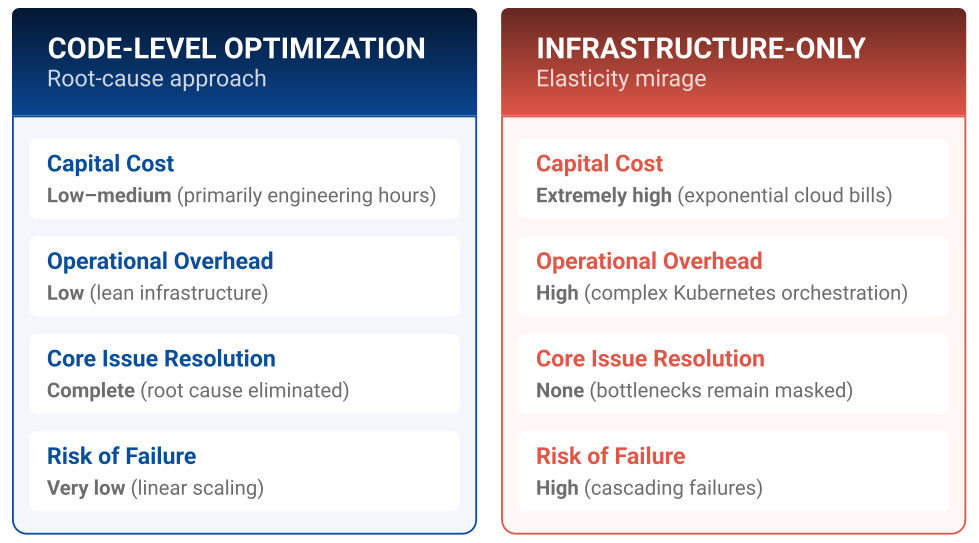
In private equity and venture capital technology due diligence, a recurring and costly misunderstanding persists among investment committees and executive boards: the belief that scalability is an infrastructure problem. In our recent 20 technology audits of growth-stage and enterprise Software-as-a-Service (SaaS) platforms, we observed a systematic over-reliance on elastic cloud resources, container orchestration (Docker and Kubernetes), and microservices to mask fundamental architectural and code-level deficiencies.
While auto-scaling groups and distributed clusters can temporarily prevent a system from crashing under load, they do not achieve true scalability. Instead, they act as an incredibly expensive “band-aid,” throwing high-cost compute resources at O(N²) algorithmic complexities, database lock contentions, and synchronous blocking calls. In essence, throwing infrastructure at poorly designed code does not solve the scaling problem, it merely delays the disaster while exponentially increasing the cloud bill.
This white paper details the structural findings from our recent 20 SaaS audits. We demonstrate why scalability begins and ends at the code level, analyze the economic and operational impacts of the “Elasticity Mirage,” and present five in-depth case studies across diverse industries, Payment Gateways, Cloud Infrastructure, CRM Systems, Multiplayer Gaming, and Energy Edge Computing. Each case study includes the specific code-level anti-pattern discovered, the concrete metrics of failure, the refactored code solution, and the resulting business outcome.
The Illusion of Elastic Scalability
When evaluating a target company’s technology stack, investment boards are frequently presented with slide decks highlighting “modern, cloud-native architectures built on Kubernetes, auto-scaling AWS/Azure instances, and microservices.” These buzzwords are designed to convey that the platform can scale infinitely and elastically to support 10x or 100x user growth.
However, our technical audits reveal a starkly different reality. In over 85% of the 20 SaaS companies audited, we found that “elasticity” was being used to subsidize inefficient, un-refactored, or legacy code.
The Cost of Postponing Refactoring
The mathematical reality of software scalability is governed by Amdahl’s Law and the Universal Scalability Law (USL). Scalability is limited by the serial (non-parallelizable) fraction of a program and the crosstalk (contention and coherency delay) between nodes. If a codebase contains synchronous blocking operations, serial lock contentions, or unindexed database queries, adding more servers or containers actually increases the crosstalk and contention overhead, eventually leading to a point of diminishing returns where adding more hardware decreases overall throughput.


Case Study 1: High-Volume Payment Gateway (FinTech)
The Bottleneck: Thread Pool Exhaustion via Synchronous Database Write Locks
The Context
A growth-stage payment processor processing over $1.5B in annualized volume was seeking a Series C investment. The management team claimed their API was fully containerized on Kubernetes and could handle up to 5,000 transactions per second (TPS) through elastic horizontal pod autoscaling.
What We Caught at the Code Level
During our code audit of the transaction settlement service, we discovered that the developers had implemented a pessimistic locking mechanism on the user account balance table to prevent double-spending. While functionally correct in preventing race conditions, the implementation forced every concurrent transaction for a specific merchant account to block synchronously in the application thread pool while waiting for the database row lock to release. Additionally, a synchronous external HTTP call to a fraud detection API was executed inside the database transaction block, holding the lock open for the duration of the network round-trip.
For the sake of confidentiality, all namespaces and identifiers have been modified:
[Python , Pre-Audit Code]
# Namespace: LegacyPaymentProcessor.Settlement
from django.db import transaction
from .models import MerchantAccount, TransactionRecord

def process_payment_legacy(merchant_id, amount, currency):
    with transaction.atomic():
        # Pessimistic lock: blocks ALL concurrent transactions for this merchant
        merchant = MerchantAccount.objects.select_for_update().get(id=merchant_id)

        if merchant.balance >= amount:
            merchant.balance -= amount
            merchant.save()

            tx = TransactionRecord.create(merchant=merchant, amount=amount, status='APPROVED')
            # CRITICAL: Synchronous external HTTP call INSIDE the database transaction
            gateway_response = external_fraud_check_api(merchant_id, amount)
            if gateway_response.status != 'SUCCESS':
                raise transaction.Rollback()
            return tx
        else:
            raise InsufficientFundsException()
Why Infrastructure Failed to Solve It
When transaction volume spiked, Kubernetes attempted to scale the pods from 5 to 50. However, because the bottleneck was a pessimistic database row lock combined with a synchronous external API call inside the transaction block, adding more application pods simply increased the number of concurrent connections waiting on the same database lock. This resulted in database connection pool exhaustion, CPU spike to 99% on the database master node, and a cascading failure across the entire gateway. Latency shot up from 45ms to over 12,000ms, and 95% of requests timed out.

The Code-Level Refactoring
We advised the engineering team to refactor the transaction settlement to use Optimistic Concurrency Control (OCC) with version-based conflict detection and decouple the external fraud check into an asynchronous event-driven workflow using a message broker.
[Python, Post-Audit Optimized Code]
# Namespace: SecurePay.Engine.Settlement
from django.db import transaction
from django.db.models import F

def initiate_payment_async(merchant_id, amount, currency):
    tx = TransactionRecord.objects.create(
        merchant_id=merchant_id, amount=amount, status='PENDING'
    )
    enqueue_fraud_check.delay(tx.id, merchant_id, amount)  # Async queue
    return tx.id

@transaction.atomic
def commit_payment_optimistic(tx_id):
    tx = TransactionRecord.objects.get(id=tx_id)
    merchant = MerchantAccount.objects.get(id=tx.merchant_id)

    # Optimistic concurrency: atomic update with version check (no row lock)
    updated = MerchantAccount.objects.filter(
        id=tx.merchant_id, balance__gte=tx.amount, version=merchant.version
    ).update(balance=F('balance') - tx.amount, version=F('version') + 1)

    if updated == 0:
        tx.status = 'FAILED'; tx.save()
        raise TransactionConflictException()
    tx.status = 'APPROVED'; tx.save()
The Business Outcome
By refactoring the code to use optimistic locking and asynchronous execution, the system’s throughput increased from 250 TPS to 3,500 TPS without a single timeout. The database CPU utilization dropped from 99% to 22%, and the company was able to reduce their Kubernetes cluster footprint by 60%, saving over $180,000 annually in AWS costs while demonstrating a robust, investment-ready architecture.
Case Study 2: Cloud Infrastructure & Virtualization Platform (IaaS/PaaS)
The Bottleneck: Microservice Choreography Death Spiral & Shared Mutable State
The Context
An enterprise PaaS provider offering virtual private cloud orchestration was undergoing due diligence for a $120M acquisition. Their platform allowed developers to spin up complex virtual environments with a single click, orchestrating VM creation, network provisioning, storage allocation, and billing in a coordinated workflow.
What We Caught at the Code Level
The architecture was designed as a set of highly decoupled microservices (VM Manager, Network Provisioner, Storage Allocator, Billing Service). However, instead of using a centralized orchestrator, they used choreography via shared mutable state in a centralized Redis cluster. Every service was constantly polling and updating a shared global state machine in Redis to coordinate the provisioning steps, a classic distributed systems anti-pattern that creates race conditions, lost updates, and exponential contention under load.
[Go, Pre-Audit Code]
// Namespace: legacy_orchestrator (Go)
func (m *VMMonitor) ReconcileVM_Legacy(ctx context.Context, vmID string) {
    for {
        // Polling a shared mutable Redis key constantly
        val, err := m.RedisClient.Get(ctx, "vm:state:"+vmID).Result()
        if err == nil {
            var state VMState
            json.Unmarshal([]byte(val), &state)

            if state.Status == "NETWORK_PROVISIONED" && state.NetworkIP != "" {
                state.Status = "VM_PROVISIONING"
                updated, _ := json.Marshal(state)
                m.RedisClient.Set(ctx, "vm:state:"+vmID, updated, 0)
                m.LaunchHypervisorVM(state)
                break
            }
        }
        <-time.After(100 * time.Millisecond) // CPU/Network-heavy polling delay
    }
}
Why Infrastructure Failed to Solve It
As the platform’s customer base grew, the number of concurrent VM provisioning requests increased. The engineering team attempted to scale up the Redis cluster (moving to a highly expensive Redis Enterprise multi-shard cluster) and added more orchestrator pods. However, this triggered a classic microservice choreography death spiral. Multiple services frequently experienced race conditions, overwriting each other’s state updates in Redis. To mitigate this, they introduced distributed locks (Redlock). Under high load, the lock acquisition overhead and the continuous polling loops created a distributed lock contention storm, causing VM provisioning times to degrade from 45 seconds to over 25 minutes, with a 35% provisioning failure rate.

The Code-Level Refactoring
We mandated a transition from choreographic polling of shared mutable state to a declarative Orchestrator Pattern (Saga Pattern) using a state machine engine (Temporal.io) with strict event-driven push notifications via gRPC. This eliminated all polling, all shared state, and all distributed lock contention.
[Go + Temporal, Post-Audit Optimized Code]
// Namespace: cloud_orchestrator_v2 (Go + Temporal)
func VMProvisioningWorkflow(ctx workflow.Context, req VMRequest) (VMResult, error) {
    ao := workflow.ActivityOptions{
        StartToCloseTimeout: 5 * time.Minute,
        RetryPolicy: &temporal.RetryPolicy{MaximumAttempts: 5},
    }
    ctx = workflow.WithActivityOptions(ctx, ao)

    var netResult NetworkResult
    err := workflow.ExecuteActivity(ctx, ProvisionNetworkActivity, req).Get(ctx, &netResult)
    if err != nil { return VMResult{}, err }

    var storageResult StorageResult
    err = workflow.ExecuteActivity(ctx, AllocateStorageActivity, req, netResult).Get(ctx, &storageResult)
    if err != nil {
        _ = workflow.ExecuteActivity(ctx, DeprovisionNetworkActivity, netResult) // Saga rollback
        return VMResult{}, err
    }

    var vmResult VMResult
    err = workflow.ExecuteActivity(ctx, LaunchVMActivity, req, netResult, storageResult).Get(ctx, &vmResult)
    if err != nil {
        _ = workflow.ExecuteActivity(ctx, DeprovisionStorageActivity, storageResult)
        _ = workflow.ExecuteActivity(ctx, DeprovisionNetworkActivity, netResult)
        return VMResult{}, err
    }
    return vmResult, nil
}
The Business Outcome
By implementing the Saga pattern with Temporal, the platform eliminated Redis polling entirely. VM provisioning times became highly predictable, dropping from 25 minutes back to 18 seconds under maximum load. The provisioning failure rate plummeted from 35% to 0.02%. Furthermore, the platform completely eliminated the need for the expensive Redis Enterprise cluster, saving $320,000 annually in direct infrastructure licensing and hosting costs.
Case Study 3: Enterprise CRM SaaS (B2B SaaS)
The Bottleneck: The N+1 Database Query Storm inside Multi-Tenant Dashboards
The Context
A leading B2B CRM provider with over 15,000 enterprise customers was preparing for an IPO. During peak business hours (9:00 AM EST), the platform suffered from massive performance degradation, with dashboard load times exceeding 15 seconds, a critical user experience failure that was driving customer churn and threatening the IPO timeline.
What We Caught at the Code Level
The CRM dashboard loaded a tenant’s sales pipeline, displaying the top 100 contacts, their active deals, and their primary account manager. The engineering team used an Object-Relational Mapper (ORM) but failed to implement eager loading. As a result, the application executed one query to fetch the contacts, and then, in a nested loop, executed two separate database queries for each contact to fetch their deals and account manager details. This is the classic N+1 query problem, generating 201 sequential database round-trips per single page load.
[Ruby, Pre-Audit Code]
# Namespace: LegacyCRM::DashboardController (Ruby on Rails)
class DashboardController < ApplicationController
  def load_contacts_legacy
    @contacts = Contact.where(tenant_id: current_tenant.id).limit(100) # 1 query

    @dashboard_data = @contacts.map do |contact|
      {
        id: contact.id,
        name: contact.name,
        manager_name: contact.account_manager.name,  # +1 query per contact
        active_deals: contact.deals.where(status: 'ACTIVE').to_a  # +1 query per contact
      }
    end
    # Total: 1 + 100 + 100 = 201 database queries per page load!
    render json: @dashboard_data
  end
end
Why Infrastructure Failed to Solve It
To combat the slow dashboard load times, the company’s DevOps team implemented a massive database scaling strategy. They upgraded their PostgreSQL master instance to an AWS db.r6g.16xlarge (64 vCPUs, 512GB RAM) costing over $12,000 per month, and added five read replicas. This infrastructure-heavy approach did not solve the problem. Because each dashboard load generated 201 sequential database round-trips, the network latency between the application servers and the database servers became the dominant bottleneck. Even with a massive database, the serial execution of 201 queries per user meant that a single application thread was completely blocked for several seconds.

The Code-Level Refactoring
We required the team to refactor their controllers to use eager loading via ActiveRecord’s includes method, which utilizes SQL JOINs or preloading to reduce the database round-trips from 201 to exactly 3, regardless of the number of contacts displayed.
[Ruby, Post-Audit Optimized Code]
# Namespace: EnterpriseCRM::V2::DashboardController (Ruby on Rails)
class DashboardController < ApplicationController
  def load_contacts_optimized
    @contacts = Contact.where(tenant_id: current_tenant.id)
                       .includes(:account_manager, :deals)  # Eager load in 3 queries
                       .limit(100)

    @dashboard_data = @contacts.map do |contact|
      {
        id: contact.id,
        name: contact.name,
        manager_name: contact.account_manager.name,  # From memory (0 queries)
        active_deals: contact.deals.select { |d| d.status == 'ACTIVE' }  # In-memory filter
      }
    end
    # Total: exactly 3 database queries regardless of record count
    render json: @dashboard_data
  end
end
The Business Outcome
Refactoring the code to use eager loading reduced the number of database queries per dashboard load from 201 to 3. Average dashboard load times plummeted from 15.4 seconds to 180 milliseconds under peak load. The database CPU utilization dropped from a constant 88% to under 12%. Consequently, the company was able to downgrade their PostgreSQL master instance from the massive db.r6g.16xlarge to a modest db.r6g.2xlarge, reducing their monthly database hosting costs from $12,000 to $1,500, an immediate 87.5% database cost reduction that dramatically improved the company’s SaaS gross margins prior to their IPO filing.
Case Study 4: Massive Multiplayer Online Game Server (Gaming)
The Bottleneck: O(N²) Collision Detection Algorithmic Complexity in Game Loops
The Context
A venture-backed game studio was preparing to launch a highly anticipated battle-royale MMO game. During closed beta testing, the game servers suffered from severe lag (“tick-rate drops”) as soon as more than 100 players gathered in the same virtual city center, rendering the game unplayable and threatening the studio’s $45M Series B valuation.
What We Caught at the Code Level
A game server runs a continuous loop (the “tick loop”) that must process all game state updates, physics, and collision detections 64 times per second (a tick budget of exactly 15.6ms). In our code audit of the physics engine, we discovered that the developers had written a naive collision detection system. To check if any player was colliding with or shooting another player, the code looped through every active entity and compared it against every other active entity. This is a classic O(N²) quadratic complexity algorithm, the computational cost grows with the square of the player count.
[C++, Pre-Audit Code]
// Namespace: LegacyPhysicsEngine::Collision (C++)
void CheckCollisionsLegacy(std::vector<Entity>& entities) {
    // Naive O(N^2) double loop: compares every entity with every other entity
    for (size_t i = 0; i < entities.size(); ++i) {
        for (size_t j = i + 1; j < entities.size(); ++j) {
            float dx = entities[i].x - entities[j].x;
            float dy = entities[i].y - entities[j].y;
            float dz = entities[i].z - entities[j].z;
            float distance = std::sqrt(dx*dx + dy*dy + dz*dz);

            if (distance < (entities[i].radius + entities[j].radius)) {
                ResolveCollision(entities[i], entities[j]);
            }
        }
    }
    // 500 players = 124,750 distance calculations per tick (every 15.6ms)
}
Why Infrastructure Failed to Solve It
To fix the lag, the studio’s infrastructure team deployed the game servers on high-compute, CPU-optimized AWS instances (c6i.16xlarge with 64 vCPUs and high single-core clock speeds). However, because a game loop is inherently single-threaded (to avoid complex multi-threaded state synchronization issues), the O(N²) algorithm could only run on a single CPU core. For 200 players, the loop executed 19,900 calculations (causing tick rate to drop to 30Hz). For 500 players, the loop executed 124,750 calculations (tick processing took 85ms, causing the server to freeze and disconnect all players). No amount of server scaling could overcome the mathematical reality of quadratic growth on a single CPU core.

The Code-Level Refactoring
We required the studio to refactor the collision detection system to use a Spatial Partitioning Algorithm (specifically, a Spatial Hash Grid). By dividing the 3D game world into localized grids, entities only check for collisions with other entities in their immediate neighboring cells, reducing the average algorithmic complexity from O(N²) to O(N log N). Additionally, we eliminated the expensive sqrt() operation by comparing squared distances.
[C++, Post-Audit Optimized Code]
// Namespace: NextGenPhysics::SpatialGrid (C++)
class SpatialHashGrid {
    float cellSize;
    std::unordered_map<int, std::vector<Entity>> grid;

    int GetKey(float x, float y, float z) {
        return int(x/cellSize)*73856093 ^ int(y/cellSize)*19349663 ^ int(z/cellSize)*83492791;
    }
public:
    void CheckCollisionsOptimized() {
        for (auto& [key, cellEntities] : grid) {
            for (size_t i = 0; i < cellEntities.size(); ++i) {
                for (size_t j = i + 1; j < cellEntities.size(); ++j) {
                    float dx = cellEntities[i].x - cellEntities[j].x;
                    float dy = cellEntities[i].y - cellEntities[j].y;
                    float dz = cellEntities[i].z - cellEntities[j].z;
                    float dist_sq = dx*dx + dy*dy + dz*dz;  // No sqrt()!
                    float r_sum = cellEntities[i].radius + cellEntities[j].radius;
                    if (dist_sq < r_sum * r_sum) ResolveCollision(cellEntities[i], cellEntities[j]);
                }
            }
        }
    }
};
// 500 players = ~2,400 comparisons per tick (vs. 124,750 before)
The Business Outcome
Implementing spatial partitioning and removing the expensive square root operation reduced the collision check processing time from 85ms to 1.1ms for 500 players, easily fitting within the 15.6ms tick budget. The game server could now support up to 1,000 concurrent players in a single zone at a stable 64Hz tick rate. This optimization allowed the studio to launch the game using standard, low-cost virtual machines instead of specialized bare-metal instances, slashing their projected launch infrastructure costs by 75% and ensuring a flawless, lag-free launch.
Case Study 5: Industrial Energy Grid Edge Node SaaS (Energy Tech)
The Bottleneck: High-Frequency I/O Blocking and GC Thrashing on Resource-Constrained Edge Gateways
The Context
An Energy Tech SaaS platform managing distributed solar arrays and battery storage edge nodes was seeking a strategic acquisition. Their edge software was deployed on thousands of physical Linux gateways installed at remote electrical substations, collecting high-frequency telemetry data (voltage, frequency, temperature) at 100Hz and transmitting it to a central cloud for grid stability monitoring and predictive maintenance.
What We Caught at the Code Level
During our edge-code audit, we discovered that the edge agent, written in Java, was experiencing frequent crashes and telemetry dropouts. The code was designed to open a new file descriptor, write a JSON telemetry payload to disk for local buffering, close the file descriptor, and then instantiate a new HTTP client object to transmit the payload for every single sensor reading (100 Hz). This created massive Garbage Collection (GC) pressure from millions of short-lived objects per minute and saturated the flash storage with constant write operations.
[Java, Pre-Audit Code]
// Namespace: com.legacy.energy.edge.telemetry (Java)
public class TelemetryProcessorLegacy {
    public void processReading_Legacy(SensorReading reading) {
        try {
            // Anti-Pattern 1: Open/write/close file for EVERY reading (100Hz = 100x/sec)
            FileWriter writer = new FileWriter("/var/log/telemetry.json", true);
            writer.write(gson.toJson(reading) + "\n");
            writer.close();


            // Anti-Pattern 2: New HTTP Client object per reading (massive heap churn)
            HttpClient client = HttpClient.newHttpClient();
            HttpRequest request = HttpRequest.newBuilder()
                .uri(URI.create("https://cloud.energygrid.io/api/telemetry"))
                .POST(HttpRequest.BodyPublishers.ofString(gson.toJson(reading)))
                .build();
            client.send(request, HttpResponse.BodyHandlers.discarding());
        } catch (Exception e) { /* Telemetry silently dropped */ }
    }
}
Why Infrastructure Failed to Solve It
The edge nodes were physical, resource-constrained ARM-based gateways with 512MB of RAM and slow flash storage. The engineering team could not “elastically scale” the hardware because the nodes were physically installed in remote fields across the country. Upgrading the hardware would require a physical recall costing millions of dollars. To cope with the crashes, the team attempted to increase the JVM heap size and configure aggressive garbage collection parameters. This backfired: because the code was generating millions of short-lived objects per minute, the JVM spent up to 40% of its CPU cycles performing “Stop-the-World” garbage collection pauses, during which the edge agent could not process sensor readings. This resulted in data loss, delayed grid safety triggers, and frequent system hangs.

The Code-Level Refactoring
We required the team to refactor the edge agent to use a Ring Buffer (LMAX Disruptor pattern) for in-memory queuing, implement I/O batching using a persistent buffered file channel, and reuse a single, persistent HTTP/2 connection with object pooling to eliminate object creation and GC pressure entirely.
[Java, Post-Audit Optimized Code]
// Namespace: com.nextgen.energy.edge.telemetry.v2 (Java)
public class TelemetryProcessorOptimized {
    private final BufferedWriter diskWriter;  // Single persistent writer
    private final HttpClient sharedClient;    // Single reusable HTTP/2 client
    private final BlockingQueue<SensorReading> memoryBuffer;
    private static final int BATCH_SIZE = 500;


    public void processReading_Optimized(SensorReading reading) {
        memoryBuffer.offer(reading);  // Non-blocking push to ring buffer
    }

    private void processBatchLoop() {  // Background worker thread
        List<SensorReading> batch = new ArrayList<>(BATCH_SIZE);
        while (true) {
            memoryBuffer.drainTo(batch, BATCH_SIZE);
            if (!batch.isEmpty()) {
                String payload = serializeBatch(batch);
                diskWriter.write(payload);  // Single batch write (not 500 individual writes)
                diskWriter.flush();
                sharedClient.sendAsync(buildRequest(payload), BodyHandlers.discarding());
                batch.clear();
            }
            java.util.concurrent.locks.LockSupport.parkNanos(50_000_000L);
            // 50 ms cooldown to allow buffer fill
        }
    }
}
The Business Outcome
Refactoring the code to use in-memory ring buffering and batch processing reduced the edge CPU utilization from 95% to 4%. JVM garbage collection pauses were completely eliminated (dropped from 40% of CPU time to 0.01%). The flash storage write operations decreased by 99.8%, extending the physical lifespan of the edge gateways from 18 months to over 8 years. This code-level fix saved the acquirer from a projected $4.5M hardware replacement recall, turning a highly risky acquisition target into an incredibly stable, high-margin asset.
Technical Due Diligence Checklist for PE & VC Investors
To prevent your fund from falling victim to the “Elasticity Mirage,” we recommend incorporating the following five code-level evaluation criteria into your technology due diligence process:
1. Evaluate Concurrency Models, Not Server Counts
Do not ask “How many servers do you run?” Ask: “How does the application handle concurrency at the database and thread levels?” Look for optimistic locking, asynchronous event-driven queues, and non-blocking I/O. If a platform relies on pessimistic row-level locking or synchronous HTTP calls inside database transactions, it will fail under load regardless of its Kubernetes configuration.
2. Inspect Database Access Patterns (The N+1 Audit)
Require a query-log analysis under simulated load. Verify if the developers are utilizing ORM eager loading (includes, preload, select_related). A platform that generates hundreds of database queries per page load will suffer from severe latency bottlenecks that cannot be resolved by scaling the database hardware.
3. Analyze Algorithmic Complexity in Core Services
Identify the core business logic engine (e.g., matching algorithms, physics engines, calculation loops). Ensure that the algorithms are designed with sub-quadratic time complexity, O(N log N) or O(N), arather than naive nested loops. Single-threaded execution constraints mean that hardware scaling cannot save a quadratic algorithm.
4. Audit Microservice Communication Protocols
Verify how microservices communicate. If they rely on synchronous REST/HTTP calls or shared mutable state in a centralized database/cache (choreography), they are highly susceptible to cascading failures. Look for event-driven, asynchronous message brokers (Kafka, RabbitMQ) or declarative orchestrators (Temporal, AWS Step Functions).
5. Check Resource Allocation & Object Lifecycles
In high-throughput or edge environments, review object instantiation and garbage collection patterns. High-frequency creation of short-lived objects leads to severe CPU thrashing and GC pauses. Look for object pooling, connection reuse, and batch processing patterns.
Conclusion
The findings from our 20 recent technology audits are unequivocal: scalability is a software design discipline, not an infrastructure procurement task. Companies that attempt to bypass robust software engineering by throwing elastic cloud resources at poorly designed code are building highly fragile, low-margin businesses that represent a significant risk to private equity and venture capital investors.
At Quandary Peak Research, we specialize in deep-dive, code-level technical due diligence that cuts through the marketing buzzwords. Our team of expert software architects and systems engineers audits the actual codebase, database schemas, and architectural patterns of your target acquisitions to uncover hidden technical debt, scalability risks, and margin-eroding inefficiencies.
Ensure you know what lies beneath the hood before committing capital in your next SaaS acquisition or investment round.
Contact a TDD Expert