Technical considerations in the design and application of machine learning and artificial intelligence.
Recent advances and increased application of computer-aided decision making, including artificial intelligence (AI) and machine learning (ML), have caught the attention of consumer protection organizations and regulatory agencies. This article attempts to enrich this discussion from a technical perspective. To many, especially those without technical training these technologies are something of a curiosity. The fact that such systems are presented to the public as a menagerie of mysterious jargon adds to their intellectual prestige but risks imparting these tools with more deference than they deserve. At bottom, these systems are simply mechanisms through which information is processed to predict or estimate the answer to a question. Understanding that the contributions of these technologies, as impressive as they are, are no more than informed guesses is critical to understanding their limitations.
This article will attempt to illustrate these limitations through a combination of technical explanation and statistical analysis. In particular, after reading this article the reader should better understand what factors determine the reliability of a computer-aided decision algorithm. With this understanding, the reader will be better equipped to identify explicit and implicit biases and poor assumptions that can result in unreliable, unfair and discriminatory outcomes.
Consumer advocates and regulators have raised concerns regarding the potential for discriminatory and otherwise questionable outcomes when computer-aided decision-making technologies are leveraged in the context of regulated decision-making processes. So-called “automated decision making” tools are subject to Federal regulation under Section 5 of the FTC Act, the Fair Credit Reporting Act and the Equal Credit Opportunity Act. In addition, algorithms and their biases may intersect with numerous other laws or regulations [1] covering consumer privacy, consumer health and safety, civil rights, and others, in industries such as consumer goods and services, financial services (including credit lending and mortgage services), clinical software and health/fitness apps, medical devices, pharmaceuticals, and others. Concerns of algorithm bias have seen increased attention within the respective regulatory agencies, and algorithm bias is the subject of active inquiries by Congress [2] . To better understand and address the technical basis for improving compliance with these laws when using computer-aided decision making, it is important to understand how to judge the output of these tools and when it is appropriate for humans to override or disregard their recommendations.
What is Truth?
As noted above, although many such algorithms exist, go by different names, and utilize a variety of methods, they all are essentially mechanisms for using information to improve the speed and reliability of forming hypotheses, in other words, of guessing what is true based on what can be observed. [3] Obviously, what is “truth” is an epistemological consideration that goes well beyond the scope of this article. Needless to say, in this context, as with most computing, the truth typically boils down to a binary question, “0” or “1,” “yes” or “no.” As such, when we use computer-aided decision making we are usually limited to asking rather simple questions. In the context of employment, housing, credit, insurance, and other benefits, the apparent simplicity and clarity of computer-aided decision-making may seem attractive (“does this person meet certain criteria or not?”), but without knowing how to judge the credibility or reliability of the computer’s recommendation, it is at best an informed guess, and at worst a misleading or completely erroneous basis for decision making. Below we describe some key factors to consider when making these judgments.
First, what the computer algorithm can “observe” and thus use to form a recommendation is limited by what data it has access to and what parts of the data it considers. Typically, computer-aided decision algorithms are “trained” on data sets, usually in the form of spreadsheets, databases, and collections of digital images, and the accuracy of the resulting algorithm is evaluated using test data in a similar format. The reliability of the resulting algorithm is highly dependent on the quality of both the training data and the test data. The old adage, “garbage in garbage out” applies, although it can be difficult to ascertain in advance the quality of this data, or how the limitations of data affect the scope of reliable application of the resulting algorithm. Below we describe some key factors to consider when evaluating the quality and limitations of training and test data.
The Limitations of Testing
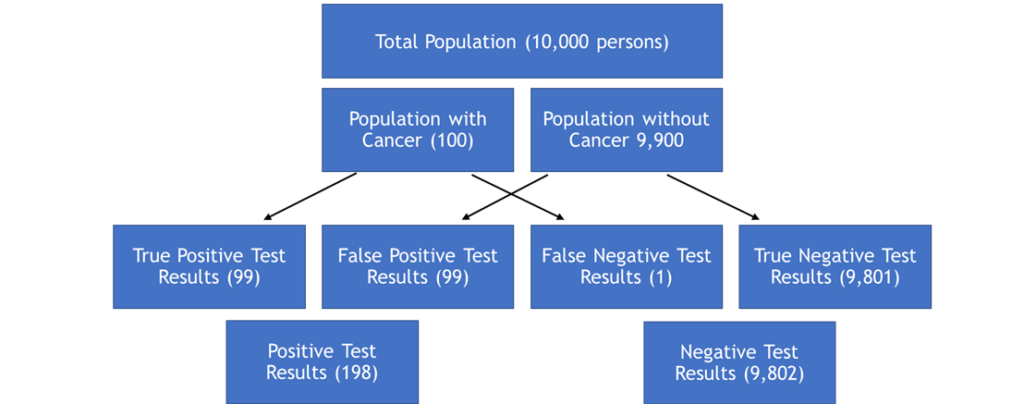
For an example of how these factors work together to give us a measure of how reliable a test is, let’s consider a hypothetical medical test. The accuracy of a medical test depends both on how often it detects the medical condition correctly and how frequently it detects the medical condition when it’s not present. To assess the reliability of a given test result a third piece of information is needed – how likely is the condition being tested for? So, say a doctor is testing for a cancer that occurs in 1% of the general population and the test being used detects cancer in 99% of the cases when cancer is present and only 1% of cases when no cancer is present. If the patient has cancer, there is a 99% chance the test will return a positive result and a 1% chance the test will return a negative result. If the patient does not have cancer, there is still a 1% chance the test will return a positive result and a 99% chance of a negative result. These may seem like certainties, but in fact the application of Bayesian statistics shows that, assuming the cancer is rare and most people who take the test do not actually have it, a positive test result has a much lower chance of being true. For example, if the cancer occurs in 1% of the tested population, it has only a 50% chance of being true.
To understand why our confidence is only 50% in the result of this test, even though it detects cancer in 99% of those who have it and only 1% of those who don’t, we need to consider some simple statistics. First, and most importantly, we assumed that the cancer we are testing for occurs in 1% of the tested population. So out of a group of 10,000 randomly selected adults we expect 100 (1%) to have the cancer. If we test all 10,000 then 99 of the 100 with the cancer will test positive (99%), but 1% of the remaining 9,900 without the cancer will test positive as well because the test has a false positive rate of 1%. Thus, 198 people will test positive but only 99 (50%) will actually have the disease. Moreover, 1 person with cancer will receive a false negative result. This logic is illustrated in the figure below.
Bayesian Logic Flow for Hypothetical Cancer Screening Test
The Prosecutor’s Fallacy
Natural reactions to this example may be disbelief, fear or anger. After all, how could medical decisions be based on a 50-50 chance? The good news is that usually they are not. First, physicians don’t typically give cancer tests to members of the general population. Patients typically have symptoms that prompt the use of a test, and doctors usually run multiple tests, and perhaps multiple types of tests, to see whether an initial positive test result is confirmed. [4]
Yet it remains the case that many highly trained physicians have trouble understanding the limitations of scientifically based and rigorously vetted medical tests that are typically subject to stringent regulatory approvals. Multiple studies have found that many medical practitioners are unaccustomed to using probability in diagnosis and clinical practice and widespread overestimates of the probability of disease likely contribute to overdiagnosis and overuse of medications and procedures. [5] Other studies have found that “statistical illiteracy” has contributed to many doctors, patients, journalists, and politicians not understanding what health statistics mean and to draw wrong conclusions from data. [6] Another study from the National Academies of Sciences Institute of Medicine concluded that most people will likely experience a diagnostic error in their lifetime. [7] These realizations have led some medical researchers to argue that the accuracy of medical screening tests should only be considered relative to a reference standard and that predictive values (such as the reliability/confidence level of the result) are more appropriate and informative when actually screening patients. [8]
These examples are interesting and eye opening, but how do they relate to algorithmic bias? First, these studies found that physicians that misunderstood test results tended to focus too much on the “accuracy” of a test without adequate consideration for the false positive rate. This tendency is common, and in the legal profession is sometimes referred to as the “prosecutor’s fallacy.” This is a fallacy of statistical reasoning involving a test for an occurrence, such as a DNA match. A positive result in the test may paradoxically be more likely to be an erroneous result than an actual occurrence, even if the test is very accurate. [9] Similarly, those who rely on recommendations provided by computer-aided decision tools may fail to adequately consider the false positive rate of the algorithm’s recommendations, and, as a result, fail to override or ignore these recommendations when appropriate. This sort of human error may be more likely when such technology is marketed and perceived by users as being very accurate, but inadequate time is given when training users of the system to give them the ability and confidence to recognize and deal with false positives.
Screening for Rarities
We will turn now to a more technological hypothetical, taken from movies and television, that will help us understand some of the practical limitations of these algorithms. First, let’s consider the difference between two applications of computer aided decision making. In the first example a computer algorithm is used to screen a large database of photographs using facial recognition to identify a specific person jaywalking across a street. In the second a customs agent scans an individual’s passport at the airport and uses a computer program to determine whether they are the person pictured on the document. The first is an example of screening, and in this case there is a possibility that multiple matches will be found, and the question is whether the correct individual is among those hits and how long it will take to identify the correct match among the subpopulation of likely matches. [10] In the second case the question is how reliably the passport scanner can correctly identify a single person and, conversely, how to interpret the result when the scanner says it can’t confirm the subject is the person identified on the passport.
To further illustrate how the confidence in a screening test result depends on both the accuracy of the test and the size of the population being screened consider the graph below, which illustrates the confidence level of a variety of hypothetical tests, each identified by the true positive and false positive rate as “% of true positive / % of false positive.” The graph shows that there are inherent limitations to the confidence level when screening for low probability events/conditions. In other words, when testing for rare things, even very accurate tests suffer from low levels of confidence. In our facial recognition examples above, screening a population for a face is a case of screening for a low probability event, whereas confirming that a person’s face matches the photo on their ID is a case of diagnosing a high-probability event.
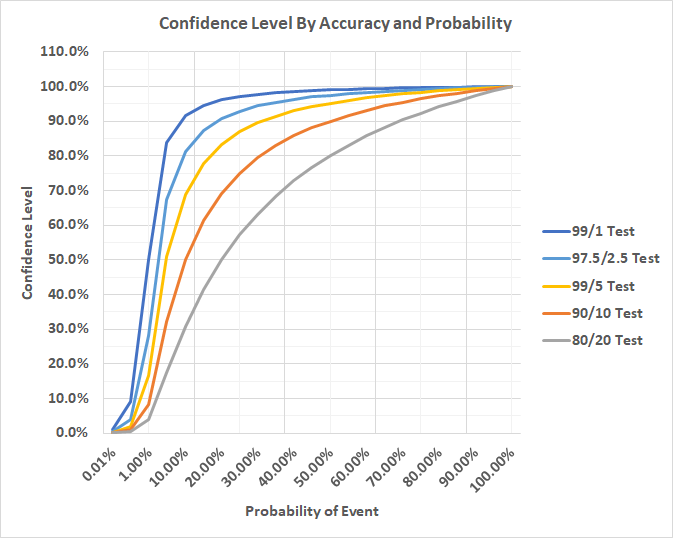
Referring to the graph, if we consider a threshold of 50% confidence (more likely than not) our 99/1 test requires that the underlying probability of the event be at least 1%. A slightly less accurate test with a true positive rate of 97.5% and a false positive rate of 2.5% requires a rate of occurrence of approximately 2.5% to cross the threshold, whereas a 95/5 test requires 5%. A 90/10 test requires a 10% rate, and an 80/20 test requires a 20% rate of occurrence to achieve a 50% level of confidence in the result. As such, Bayesian statistics shows us that even tests that are very accurate can be wrong most of the time when the underlying condition being tested for is rare.
The limitations of using tests to screen for rare conditions are particularly problematic in the context of computer-based screening and diagnostic methods because the value of such systems is generally correlated with detecting relatively rare, but significant, events or conditions. Using computer-assisted decision algorithms to screen for commonplace events is more reliable, but it is not what these systems are typically envisioned for. As noted above, in popular culture facial recognition software is depicted as a way to identify an individual from a population using a picture, but in reality, facial recognition is more reliable when used to verify the identity of a single individual. This is because when screening a population for one face, the correct result for any given search is necessarily one person. For any large population of subjects, for example, a database of all driver’s license photos of individuals living in a state or large city, the probability of randomly selecting the correct individual is always one divided by the total population being screened. So, searching for a face in a database of tens of thousands will necessarily produce many possible matches, even if the facial recognition algorithm is very accurate. On the other hand, when verifying the identity of an individual from their ID these considerations are reversed. It is far more likely that an individual is the person shown on their ID than it is that they are not. In this case the more relevant concern is a false negative, but in this case it is more practical for the customs agent to use their own judgement when the algorithm cannot confirm the identity of a subject. [11]
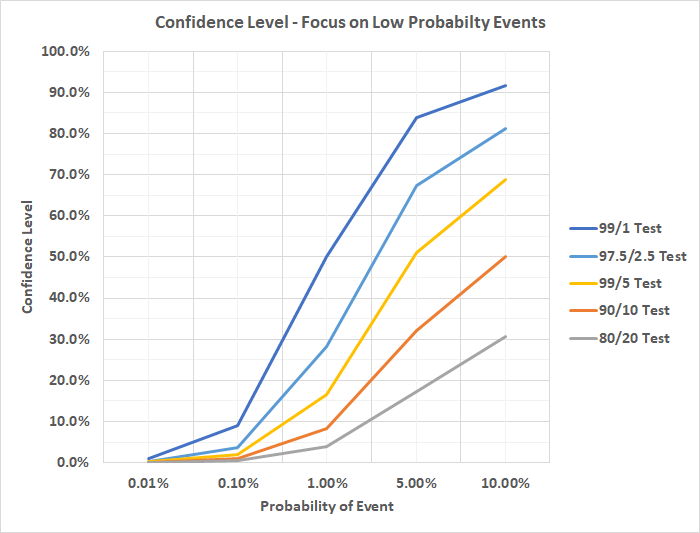
Indeed, when screening for rarities it is just as important to understand the underlying (so-called “prior”) probability of the event or condition being screened for as it is to understand how accurate the test is, especially when dealing with algorithms known to have even modest error rates. For illustration, consider the graph below, which focuses on the lower probability range of the prior graph. Again, consider the example of using facial recognition to screen a modest population of 10,000 for an individual. The prior probability of a randomly selected person being the one we are looking for is 0.01%, which is the lower left bound of the graph below. As the graph makes clear, even if our algorithm properly matches faces 99% of the time and only misidentifies faces 1% of the time (dark blue line), the confidence we can have in any match is only 1%. Even though we can be confident the algorithm will probably (but not certainly) identify our subject, it may also identify 99 other individuals.
Sticking with our facial recognition example, significant racial disparities in the accuracy of facial recognition algorithms have been well studied, for example by the Department of Homeland Security (DHS) [12] and the National Institute of Standards and Technology (NIST). [13] The NIST study found that facial recognition algorithms found 10 to 100 times more false positives for Black or Asian Americans than for Caucasian Americans, depending on the algorithm. In particular, NIST found that 189 face recognition algorithms tested were least accurate on women of color. IBM, Amazon, and Microsoft have since announced they would pause or end sales of their face recognition technology to police in the United States, citing concerns for human rights, mass surveillance, and racial profiling. [14] These companies notably did not voice concern about their facial recognition systems’ lack of reliability, however.
Minor Differences, Major Consequences
Small differences in the accuracy of screening algorithms have a large impact on the quality of the results. The 2019 NIST study found that the accuracy of facial recognition for lighter male faces was 20-34% better than for darker female faces, depending on the software used. Assuming that the overall accuracy for lighter males is in the range typically advertised by facial recognition vendors, between 0.2% and 2%, the result reported by NIST suggests that for each subject identified by a facial recognition screen of a lighter male, as many as 150 subjects could be identified from a darker female face in a population of the same size.
Various explanations for these disparities have been proposed. The most salient of these focus on the data used to train and test the algorithms. In particular, the databases of images utilized to train such algorithms have historically been dominated by lighter male subjects, often college students. The good news is that this is a solvable problem, as noted by William Crumpler, Research Associate in the Strategic Technologies Program at the Center for Strategic and International Studies: [15]
NIST also came to several encouraging conclusions. The first is that differences between demographic groups were far lower in algorithms that were more accurate overall. This means that as facial recognition systems continue to improve, the effects of bias will be reduced. Even more promising was that some algorithms demonstrated no discernible bias whatsoever, indicating that bias can be eliminated entirely with the right algorithms and development processes. The most important factor in reducing bias appears to be the selection of training data used to build algorithmic models. If algorithms are trained on datasets that contain very few examples of a particular demographic group, the resulting model will be worse at accurately recognizing members of that group in real world deployments. NIST’s researchers theorized that this may be the reason many algorithms developed in the United States performed worse on Asian faces than algorithms developed in China. Chinese teams likely used training datasets with greater representation of Asian faces, improving their performance on that group.
In contrast to the use of facial recognition algorithms, the use of computer-aided decision algorithms for making employment, housing, credit, insurance, or other benefits decisions is relatively nascent, subject to little or no direct regulation, and has not been studied or evaluated as carefully for bias or disparate impact. Given our experience with facial recognition technologies, however, the link between algorithmic bias and the data sets used to train and test these algorithms warrants closer consideration.
Thus, the considerations recently raised by consumer advocates and regulators are worth exploring, but the difficulties encountered with statistical illiteracy in the field of medical testing and the lack of transparency or accountability for facial recognition bias suggest that self-regulatory measures may be insufficient to avoid the pitfalls of using this technology in the finance, insurance, and real-estate sector. As discussed below, algorithm design is nuanced and design choices may be influenced by both compliance considerations and the incentives and biases of human actors that can result in less than optimal results.
Consider another example, this time involving consumer lending. If a computer-aided decision algorithm is used to determine whether a given applicant presents a credit risk, then our confidence in the result depends on the same type of facts discussed above: the general rate of risky borrowers. Second, the likelihood the algorithm will identify applicants that are a credit risk; and the likelihood that the algorithm will incorrectly flag a borrower that is not a credit risk.
It doesn’t take much imagination to see how difficult it is to measure or objectively estimate these quantities. For example, the historical data that is available may well incorporate implicit biases and make it difficult to objectively assess the underlying probability of credit risk in the general population. Certain populations were historically excluded from lending. Moreover, unless a borrower secured a loan from another lender after being first rejected, it’s hard to say how one can measure how frequently good borrowers have been declined credit.
When to be Skeptical
If a decision algorithm is oriented in such a way that makes it difficult or impossible to objectively evaluate its reliability, then it should be treated with skepticism. One possible solution to this is so-called “explainable AI,” which uses a set of tools and frameworks to help users understand and interpret recommendations made by decision aids. This information can help organizations improve these tools through identifying what data attributes contribute most significantly to unreliable or biased recommendations. Of course, the utility of explainable AI depends at least in part on first recognizing algorithmic bias, which can be difficult.
One way to indirectly assess algorithmic bias is by statistical comparison. But if there is not enough data to perform such an analysis, algorithms must necessarily be evaluated using anecdotal evidence and subjective judgements rather than objectively verifiable information. Moreover, even if a statistical comparison is viable there are typically many possible factors that must be controlled for in order to test for algorithmic bias. In other words, an algorithm can be resistant to bias investigation. In the case of our example above, an algorithm that is oriented towards detecting credit risks may be resistant to bias investigation because the investigation calls for proving a negative – how frequently good borrowers were declined credit. Statistical comparison is of limited utility when the basis for comparison is uncertain.
One possible answer to this problem is to reorient the decision algorithm to make use of available data. For example, it could make sense to design the algorithm to identify good borrowers rather than flag bad ones. The reason for this is that data exists for the borrowers who were approved and paid off their loans and for those that were approved and defaulted. The risk with this approach is, of course, that past biases may be extended into future lending decisions. The algorithm can be biased to training data, i.e., those “believed” to be good applicants who’ve been previously selected by humans. If biases resulted in certain populations being excluded from the lending process in the past then it is possible that using the data for those who received loans to train an algorithm will perpetuate those biases, resulting in the continued exclusion of underserved populations.
On the other hand, Federal regulators have defined a number of criteria that lenders are prohibited from considering when making such decisions, including the applicant’s race, color, religion, national origin, sex, marital status, age, or because the applicant receives public assistance. These factors only raise an issue, however, when they are found to be the basis for declining credit. Thus, an algorithm that can show affirmatively what factors a decision to decline an applicant were based on, through discoverable AI, for example, may be preferable from a compliance perspective.
Despite its inherent limitations, the “credit-risk” screening approach described above more readily lends itself to explaining a decision to decline credit to a borrower. Since the features of a borrower that are the basis for declining credit can be positively shown, the lender can more readily demonstrate that the assessment of default risk was made without considering the specific factors that are prohibited by law. Nonetheless, such algorithms may still exhibit bias. In the past, various discriminatory practices such as redlining, were used to achieve discriminatory outcomes without resorting to explicit bias. Surely algorithms can suffer from implicit bias as well, but how?
Choose Features Wisely
One source of implicit bias in algorithms has to do with inappropriate or inadequate feature selection. Feature selection is the process by which input variables that are believed to be most useful to an algorithm are selected. Feature selection should usually be primarily focused on removing non-informative or redundant information. The algorithm designer either automatically or manually selects those features which contribute most to the algorithm’s predictions. Explainable AI can be used to enhance and guide this process.
Having irrelevant features can decrease the accuracy of the algorithm or make it learn based on irrelevant features, resulting in unexpected and undesirable behavior. Such behavior can be hard to detect when there is a lack of historical data to use for comparison. Disparate impacts may be papered over by subjective, inaccurate assumptions of the underlying probability of adverse outcomes in historically underserved populations, rather than recognizing design defects such as inappropriate or inadequate feature selection.
One difficulty that arises in feature selection occurs when the data being fed into the algorithm comes from sources that contain a large number of fields that are difficult to reliably or economically sort or filter, such as prior loan records, credit reports, web search results, and social media posts. Moreover, while some of the information contained in these records, such as age, race, and ethnicity is explicitly banned by law from being considered, other data that are not explicitly related to an individual’s protected status may nonetheless be highly correlated with such attributes. Thus, the algorithm can learn to discriminate against protected classes based on information that implies their age, race, or ethnicity, without explicitly relying on those attributes. This indirect form of algorithmic bias is difficult to detect, but explainable AI can make it easier to determine what features the algorithm is relying on in order to determine whether those features are appropriate.
Ideally, if certain information is of little value to the question being answered by the algorithm it should be removed from consideration to prevent the algorithm from learning implicit biases. On the other hand, our experience with facial recognition has taught us that test data that contains few examples of particular demographic groups can result in an algorithm that performs worse for those groups. As such, it may be appropriate to deliberately enrich training and test data with cases pertaining to particular demographic groups.
An algorithm that is trained on data that reflects past decision making that is colored by illicit biases may learn to reproduce those biases if given enough information to do so. As such, it may be important to test the data for bias before using it to train or test the algorithm. In the end, an algorithm that is trained using relevant and unbiased data that reflects the population it will be used with will probably do a better job of answering the question it is designed to in a fair and unbiased manner.
Implicit biases can arise in such algorithms not only from inadequate sampling and historically biased data, but also through adverse sample selection. Such biases can result from a combination of so-called base rate bias and confirmation bias. Base rate bias can occur, for example, when a decision algorithm is trained with data that contains a significantly higher prevalence of adverse outcomes than are found in the general population.
Similarly, if the training and test data contains a disproportionate number of adverse cases that include data for particular attributes that are not populated as frequently in positive cases, the algorithm may learn to associate those attributes (features) with adverse outcomes even though they are generally neutral (or even positive) indicators in the general population. These biases can be reduced by limiting the number of adverse cases in the training set to a level that approximates the general population and by making sure that features are populated in both adverse and positive cases in line with their rate of occurrence in the general population. Moreover, as noted above, it is also advisable to eliminate features from consideration if they are of little predictive value.
The result of adverse feature or data selection in training and test data is often an algorithm with a high true positive rate during testing. This can result in a confirmation bias that causes developers to ignore, or simply fail to recognize the latent potential for a high false positive rate when the algorithm is used with the general population. In the example of a credit risk screening algorithm presented above, an algorithm designed to detect default risk may flag most or all of the borrowers that defaulted on their loans during testing, but the rate of false positives cannot be accurately measured. When used with actual customers the algorithm may continue to flag most high-risk borrowers, but it may also flag more good borrowers than bad ones. Proving that this abundance of false positives disparately impacts a protected class may be difficult, but statistical comparisons, like those used to show algorithmic bias in facial recognition, may help identify instances where bias results in disparate impacts. Moreover, explainable AI may help us understand why this happens. Once the algorithm is in use, however, it may be difficult for those using it to justify overriding its recommendations, even if bias becomes apparent.
We should also consider how to provide incentives to encourage human behaviors to counter algorithmic bias. It can be difficult to properly evaluate the reliability of algorithms like our “credit-risk” example, because doing so calls for proving a negative. [16] In this example, if default rates remain low the lender may simply ignore the base default rate (general probability
of default) in favor of the algorithm’s more frequent recommendation to reject borrowers, rather than taking the risk of identifying and overriding false positives. The hesitancy of humans to override false positives is sometimes explained as a risk aversion bias, described as “foregone gains are less painful than perceived losses.”’ [17] But the result, as in this example, may be simply that worthy borrowers are flagged as a credit risk by a flawed algorithm and declined credit along with risky ones. In this example, enforcement and civil actions can provide lenders with incentives to use their own judgement to override the algorithm when it declines credit to worthy borrowers. Creating a perception of potential loss associated with the failure to properly supervise such algorithms could help to turn the table on the cost/benefit calculation and promote more equitable outcomes. [18]
Promising, but Limited
In conclusion, computer-assisted decision algorithms show enormous promise but have their limitations – limitations which may cause harm and are increasingly the focus of regulators, lawmakers and consumer advocacy groups. In particular, using algorithms to screen for rare events bears inherent limitations on reliability. Algorithms may suffer from design flaws and adverse feature and data selection that extend biases in past decision making, find erroneous patterns in irrelevant data, or make erroneous decisions based on an incomplete or distorted model. In all of these cases the result is likely economically inefficient and can potentially run afowl of several consumer protection laws, or evidence discrimination if these deficiencies result in disparate impacts for members of a protected class. Key considerations in algorithmic design further include the impact of compliance concerns and human incentives on the orientation of decision making and the ability for the reliability of algorithms to be objectively measured or estimated. Finally, it may be necessary to incentivize operators of such algorithms to supervise and, when necessary, override the algorithm’s recommendations, while also considering external independent economic factors that may also be considered by such algorithms.

